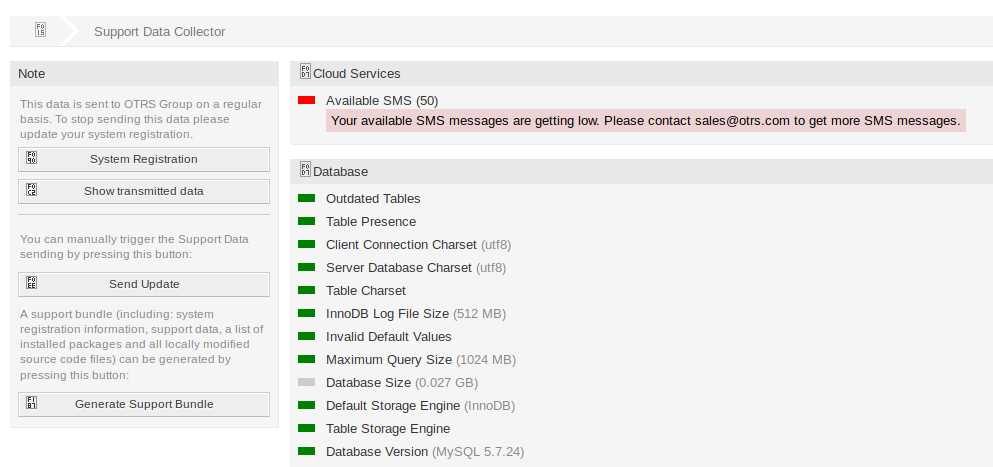
Support data collector is used to collect some data and sent to OTRS Group on a regular basis, if the system is registered.
Use this screen to review the data to be sent to OTRS Group. The support data collector screen is available in the Support Data Collector module of the OTRS Group Services group.

Manage Support Data Collector
Support data collector is used to collect some data and sent to OTRS Group on a regular basis, if the system is registered. To register your system:
-
Click on the System Registration button in the left sidebar.
-
Follow the registration instructions.
To show what kind of data will be sent:
-
Click on the Show transmitted data button in the left sidebar.
-
Review the System Registration Data and Support Data in the newly opened screen.
To manually trigger the support data sending:
-
Click on the Send Update button in the left sidebar.
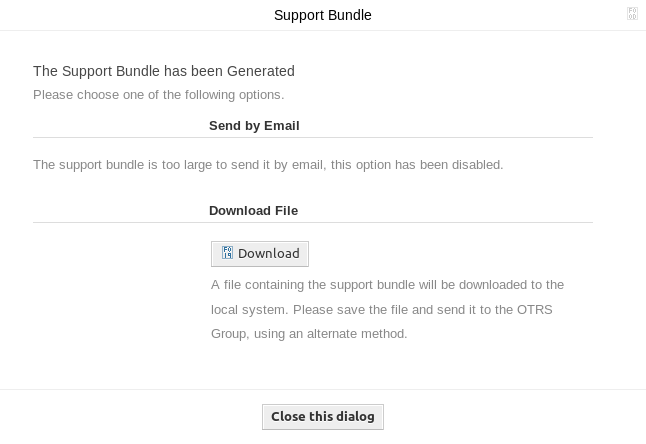
To generate a support bundle:
-
Click on the Generate Support Bundle button in the left sidebar.
-
Download the generated support bundle.
-
Open it with an archive manager and review the content.

Collected Data
The screen contains several sections. Each section has some entries with a traffic light, that indicates the following:
-
Gray LED means information, just displays a value.
-
Green LED means OK, the entry has a good value.
-
Yellow LED means notification, you have to check the value, but it is not an error.
-
Red LED means error, you have to do something to solve the issue.
Cloud Services Section
This section displays information about OTRS cloud services.
- Available SMS
-
This entry shows information about your available SMS messages. If they are getting low, the LED changes to red.
Database Section
This section displays information about the database used by OTRS.
- Outdated Tables
-
Display the outdated database tables. Green LED means, there are no outdated tables.
- Table Presence
-
Display whether all needed tables exist in the database or not.
- Client Connection Charset
-
Display the character set for the client connection. It must be
utf8. - Server Database Charset
-
Display the character set of the database server. It must be
utf8. - Table Charset
-
Display the character set of the database table. It must be
utf8. - InnoDB Log File Size
-
Display the log file size for InnoDB driver. It must be at least
512 MB. - Invalid Default Values
-
Display the invalid default values. Green LED means, there are no invalid default values.
- Maximum Query Size
-
Display the maximum size of a database query. It must be at least
1024 MB. - Database Size
-
Display the size of database. This is just an information.
- Default Storage Engine
-
Display the default storage engine of the database. It must be
InnoDB. - Table Storage Engine
-
Display the storage engine of the database tables. It must be
InnoDB. - Database Version
-
Display the database driver version. Green LED means, the version is high enough.
Document Search Section
This section displays information about document search and the used cluster.
- Cluster
-
The name of the used cluster.
- Cluster Health Details
-
Display some internal variables of the used cluster.
- Indices Health
-
Display information about indices.
- Indices Size
-
Display the size of each index.
- Node Health
-
Display information about the used node.
Operating System Section
This section displays information about the running operating system and installed software components.
- Environment Dependencies
-
Display information about environment dependencies.
- OTRS Disk Partition
-
Display the disk partition to where OTRS is installed.
- Information Disk Partitions Usage
-
Display the used space per disk partitions.
- Distribution
-
Display the distribution name of the operating system.
- Kernel Version
-
Display the kernel version of the operating system.
- System Load
-
Display the system load of the operating system. The system load should be at maximum the number of CPUs the system has (e.g. a load of 8 or less on a system with 8 CPUs is OK).
- Perl Version
-
Display the version of Perl.
- Free Swap Space (%)
-
Display the free swap space as percentages. There should be more than 60% free swap space.
- Used Swap Space (MB)
-
Display the used swap space in megabytes. There should be no more than 200 MB swap space used.
OTRS Section
This section displays information about the OTRS instance.
- Article Search Index Status
-
Display information about indexed articles.
- Articles Per Communication Channel
-
Display the number of articles per communication channels.
- Communication Log
-
Display aggregated information about communications.
- Communication Log Account Status (last 24 hours)
-
Display information about communication log account status in the last 24 hours.
- Concurrent Users Details
-
Display information about the logged in users at the same time separated by hourly.
- Concurrent Users
-
Display information about the number of maximum logged in users in the same time.
- Config Settings
-
Display some important configuration settings from system configurations.
- Daemon
-
Display whether the OTRS daemon is running or not.
- Database Records
-
Display the main OTRS object and the related number of records in the database.
- Default Admin Password
-
Green LED means, that the default administrator password was changed.
- Email Sending Queue
-
Display the number of emails that are queued for sending.
- FQDN (Domain Name)
-
Display the fully qualified domain name set in system configuration setting FQDN.
- File System Writable
-
Display whether the file system is writable or not.
- Legacy Configuration Backups
-
Green LED means, there are no legacy configuration backup files found.
- Package Installation Status
-
Green LED means, that all packages are installed correctly.
- Package Framework Version Status
-
Green LED means, that the OTRS framework version is suitable for the installed packages.
- Package Verification Status
-
Green LED means, that all installed packages are verified by the OTRS Group.
- Package List
-
Display the list of installed packages.
- Push Events Status
-
Display the status of the push events per day.
- Session Config Settings
-
Display the maximum allowed sessions per agents and customers.
- Spooled Emails
-
Display the number of emails that are in the sending pool.
- SystemID
-
Display the system identifier set in system configuration setting SystemID.
- Invalid Users with Locked Tickets
-
Display the number of users, who are set to invalid, but have some ticket locked for him.
- Open Tickets
-
Display the number of open tickets in the system. You will not have performance trouble until you have about 60,000 open tickets in your system.
- Ticket Search Index Module
-
Display the ticket search index module set in system configuration setting Ticket::SearchIndex::ForceUnfilteredStorage.
- Time Settings
-
Display timezone information for OTRS, for the calendars and for users.
- UI – Agent Skin Usage
-
Display the used skins per agents.
- UI – Agent Theme Usage
-
Display the used theme on the agent interface.
- UI – Special Statistics
-
Display some statistics about personal modifications like using favorites, custom menu ordering, etc.
- OTRS Version
-
Display the version number of OTRS.
- WebSocket Connection
-
Display connection status for WebSocket connections.

